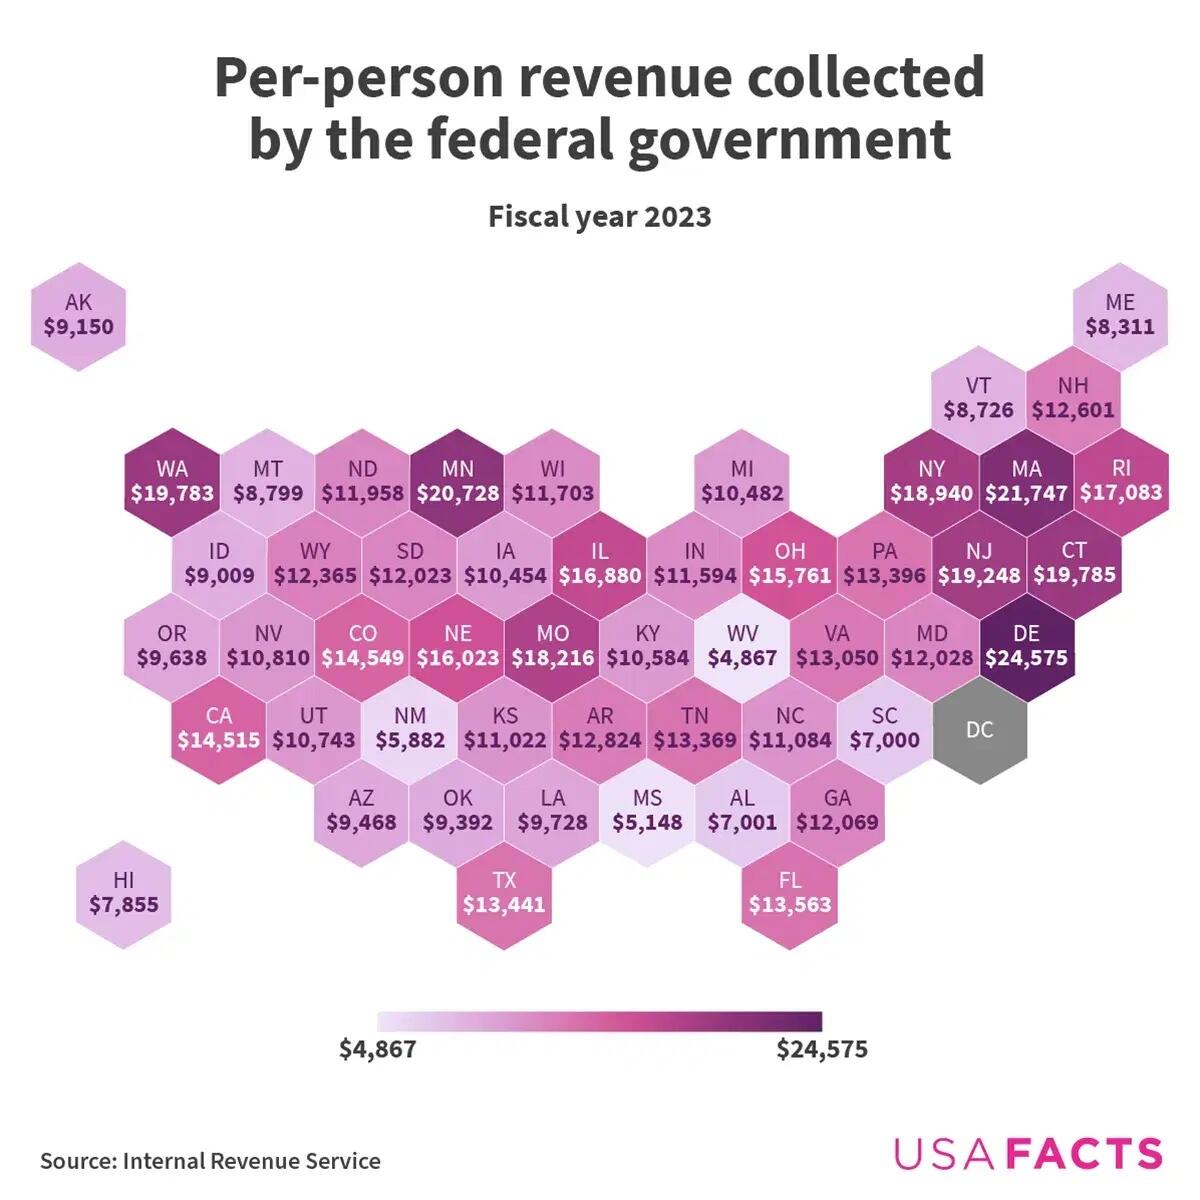
Which States Pay The Most (& Least) US Federal Tax Revenue Per Person
In 2023, the U.S. federal government collected $4.67 trillion in taxes and redistributed $4.56 trillion back to states and residents. But which states contributed the most—and least—on a per-person basis?
This dataset, originally published by USAFacts, shows how much federal revenue each state generated per capita.
Rank
State
Federal tax revenue per capita (FY 2023)
1
Delaware
$24,575
2
Massachusetts
$21,747
3
Minnesota
$20,728
4
Connecticut
$19,785
5
Washington
$19,783
6
New Jersey
$19,248
7
New York
$18,940
8
Missouri
$18,216
9
Rhode Island
$17,083
10
Illinois
$16,880
11
Nebraska
$16,023
12
Ohio
$15,761
13
Colorado
$14,549
14
California
$14,515
15
Florida
$13,563
16
Texas
$13,441
17
Pennsylvania
$13,396
18
Tennessee
$13,369
19
Virginia
$13,050
20
Arkansas
$12,824
21
New Hampshire
$12,601
22
Wyoming
$12,365
23
Georgia
$12,069
24
Maryland
$12,028
25
South Dakota
$12,023
26
North Dakota
$11,958
27
Wisconsin
$11,703
28
Indiana
$11,594
29
North Carolina
$11,084
30
Kansas
$11,022
31
Nevada
$10,810
32
Utah
$10,743
33
Kentucky
$10,584
34
Michigan
$10,482
35
Iowa
$10,454
36
Louisiana
$9,728
37
Oregon
$9,638
38
Arizona
$9,468
39
Oklahoma
$9,392
40
Alaska
$9,150
41
Idaho
$9,009
42
Montana
$8,799
43
Vermont
$8,726
44
Maine
$8,311
45
Hawaii
$7,855
46
Alabama
$7,001
47
South Carolina
$7,000
48
New Mexico
$5,882
49
Mississippi
$5,148
50
West Virginia
$4,867
Delaware led all states with $24,575 in federal taxes paid per resident, driven by high levels of business incorporation. Massachusetts ($21,747) and Minnesota ($20,728) followed, thanks to high average incomes. Meanwhile, the lowest contributors per person were West Virginia ($4,867), Mississippi ($5,148), and New Mexico ($5,882).
The Population-Revenue Disconnect
While California, Texas, New York, and Florida are the top contributors in absolute terms, collectively making up more than a third of all U.S. federal revenue, the per capita view tells a different story.
Smaller states with wealthy or business-friendly profiles, like Connecticut and New Jersey, rank much higher in per-person contributions.
Washington, D.C., is an outlier, contributing $54,612 per resident. That’s more than twice the amount of the top state. This is largely due to the city’s dense concentration of high-income earners and government-affiliated economic activity.
Do States Get Back What They Pay In?
Not all federal dollars stay in Washington. Most are returned to residents and states through entitlement programs like Social Security and Medicaid, as well as infrastructure, education, and defense.
However, some states get more than they give. In 2023, 19 states were net contributors—sending more to the federal government than they received. New York tops that list with a $89 billion net outflow. Conversely, Virginia received about $79 billion more than it paid in, largely due to defense spending.
Explore how federal money moves over time in our recommended Voronoi post: U.S. Federal Government Finances Over Time.
Tyler Durden
Fri, 06/13/2025 – 05:45