Mapping Every Understaffed Air Traffic Control Tower In The US
Earlier this year, the U.S. experienced one of its deadliest air mishaps in two decades.
An American Airlines passenger plane collided with a U.S. Army Black Hawk helicopter sending both into the Potomac River.
ℹ️ For reference: American Airlines has one of the worst track-records when it comes to crashes.
In the immediate aftermath, officials mentioned that short-staffed air traffic control towers may have played a role. This was later deemed not the cause, but air traffic control staffing shortages are plaguing 44% of all FAA regulated towers, latest data shows.
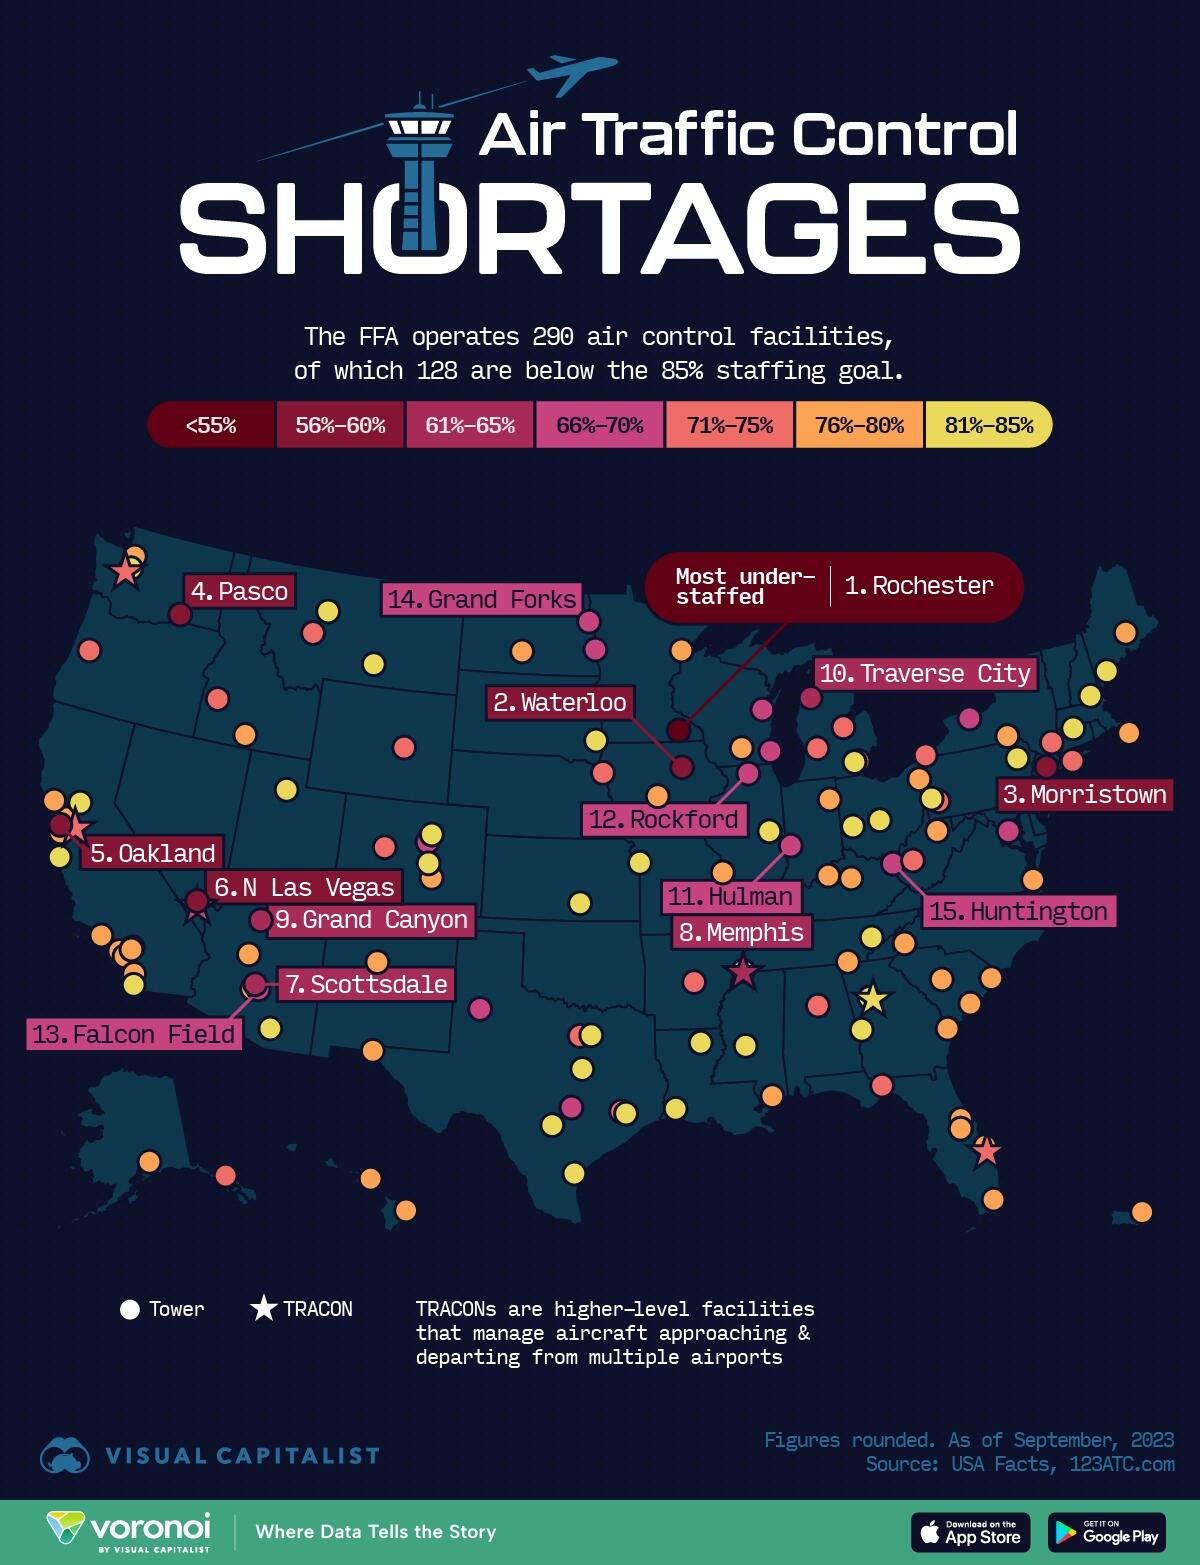
Visual Capitalist’s Pallavi Rao maps outevery single tower that is below the 2024-guideline staffing threshold (85%) per the latest available data current to September 2023, published by the FAA.
Ranked: All Short-Staffed Air Traffic Control Towers
128 of the 290 FAA-operated air traffic control towers across the country are short-staffed.
Rochester Tower, located in Minnesota has less than half the required controllers per 2024 requirements.
The table below lists all facilities by the percentage of staff filled.
Rank
Facility
Facility Code
% Staffed
1
Rochester Tower
RST
47.8
2
Waterloo Tower
ALO
56.5
3
Morristown Tower
MMU
57.9
4
Pasco Tower
PSC
58.8
5
Oakland Tower
OAK
60.0
6
North Las Vegas Tower
VGT
60.0
7
Scottsdale Tower
SDL
62.5
8
Memphis TRACON
M03
63.4
9
Grand Canyon Tower
GCN
64.3
10
Traverse City Tower
TVC
64.3
11
Terre Haute /Hulman Tower
HUF
65.5
12
Rockford Tower
RFD
65.6
13
Falcon Field Tower
FFZ
66.7
14
Grand Forks Tower
GFK
66.7
15
Huntington Tower
HTS
66.7
16
Las Vegas TRACON
L30
67.9
17
Andrews Tower
ADW
68.2
18
Centennial Tower
APA
69.2
19
Fargo Tower
FAR
69.2
20
Green Bay Tower
GRB
69.2
21
Lubbock Tower
LBB
69.2
22
Milwaukee Tower
MKE
69.4
23
Willow Run Tower
YIP
69.6
24
Austin Tower
AUS
70.0
25
Rochester Tower
ROC
70.3
26
Tallahassee Tower
TLH
70.8
27
Charleston Tower
CRW
71.0
28
Allegheny Tower
AGC
71.4
29
Aspen Tower
ASE
71.4
30
St Lucie Tower
FPR
71.4
31
Grand Rapids Tower
GRR
71.4
32
Hayward Tower
HWD
71.4
33
Saginaw Tower
MBS
71.4
34
Orlando Tower
MCO
71.4
35
Sioux Gateway Tower
SUX
71.4
36
Casper Tower
CPR
72.2
37
Seattle TRACON
S46
73.1
38
Hooks Tower
DWH
73.7
39
Juneau Tower
JNU
73.7
40
Little Rock Tower
LIT
73.7
41
Boise Tower
BOI
73.8
42
Meacham Tower
FTW
73.9
43
Islip Tower
ISP
73.9
44
Birmingham Tower
BHM
74.4
45
Erie Tower
ERI
75.0
46
Eugene Tower
EUG
75.0
47
Helena Tower
HLN
75.0
48
Poughkeepsie Tower
POU
75.0
49
Fort Wayne Tower
FWA
75.9
50
Duluth Tower
DLH
76.0
51
Youngstown Tower
YNG
76.0
52
Binghamton Tower
BGM
76.2
53
Ontario Tower
ONT
76.2
54
Madison Tower
MSN
76.7
55
Long Beach Tower
LGB
76.9
56
John Wayne Tower
SNA
76.9
57
Vero Beach Tower
VRB
76.9
58
El Paso Tower
ELP
77.1
59
Memphis Tower
MEM
77.1
60
Norfolk Tower
ORF
77.1
61
Gulfport Tower
GPT
77.3
62
San Juan Tower
SJU
77.3
63
Tamiami Tower
TMB
77.3
64
Bangor Tower
BGR
77.4
65
Albuquerque Tower
ABQ
77.8
66
Bismarck Tower
BIS
77.8
67
Hilo Tower
ITO
77.8
68
Myrtle Beach Tower
MYR
77.8
69
Prescott Tower
PRC
77.8
70
Pueblo Tower
PUB
77.8
71
Sanford Tower
SFB
77.8
72
Savannah Tower
SAV
78.1
73
Nantucket Tower
ACK
78.6
74
Columbia Tower
CAE
78.6
75
Concord Tower
CCR
78.6
76
Camarillo Tower
CMA
78.6
77
Palomar Tower
CRQ
78.6
78
Des Moines Tower
DSM
78.6
79
Bowman Tower
LOU
78.6
80
Merrill Tower
MRI
78.6
81
Paine Tower
PAE
78.6
82
Palo Alto Tower
PAO
78.6
83
Sonoma Tower
STS
78.6
84
Spirit Tower
SUS
78.6
85
Twin Falls Tower
TWF
78.6
86
Maui Tower
OGG
78.9
87
Chattanooga Tower
CHA
79.2
88
Clarksburg Tower
CKB
79.2
89
Charleston Tower
CHS
79.3
90
Asheville Tower
AVL
80.0
91
Chino Tower
CNO
80.0
92
Central Florida TRACON
F11
80.0
93
Lexington Tower
LEX
80.0
94
Phoenix Tower
PHX
80.0
95
Corpus Christi Tower
CRP
80.5
96
Northern California TRACON
NCT
80.5
97
Wilkes-Barre Tower
AVP
80.8
98
Bradley Tower
BDL
81.0
99
Champaign Tower
CMI
81.0
100
Lake Charles Tower
LCH
81.0
101
Monroe Tower
MLU
81.0
102
Knoxville Tower
TYS
81.1
103
Dayton Tower
DAY
81.3
104
Manchester Tower
MHT
81.3
105
Colorado Springs Tower
COS
81.5
106
Atlanta TRACON
A80
81.8
107
Columbus Tower
CMH
81.8
108
Sioux Falls Tower
FSD
81.8
109
Jackson Tower
JAN
81.8
110
Salt Lake City Tower
SLC
81.8
111
Tuscon Tower
TUS
81.8
112
San Diego Tower
SAN
82.1
113
San Antonio Tower
SAT
82.1
114
Pittsburgh Tower
PIT
82.2
115
Wichita Tower
ICT
82.5
116
Great Falls Tower
GTF
82.6
117
Atlanta Tower
ATL
82.7
118
Denver Tower
DEN
82.9
119
Ann Arbor Tower
ARB
83.3
120
Billings Tower
BIL
83.3
121
Columbus Tower
CSG
83.3
122
Monterey Tower
MRY
83.3
123
Downtown Tower
MKC
84.2
124
Waco Tower
ACT
84.6
125
Dallas Love Tower
DAL
84.6
126
Houston Intercontinental Tower
IAH
84.6
127
Portland Tower
PWM
84.6
128
Seattle Tower
SEA
84.8
Of particular interest are the short-staffed TRACONs (Terminal Radar Approach Control); these are bigger facilities that assist with landing and departure for larger areas.
In fact, these numbers are a more optimistic view of the staffing shortage. They include fully-certified controllers, those that have transferred from a different facility and getting familiar with a new environment, and those just out of academy who are picking up on-the-job skills.
If looking at just the fully certified controllers, these rates drop even further.
For reference, it takes roughly 2–3 years for an academy graduate to become fully certified.
Why is There an ATC Staffing Shortage?
There are a few interlinked reasons.
As a mentioned earlier, it’s a difficult (and long) training process, which takes a minimum of 2-3 years. The COVID-19 pandemic interrupted or paused training and now the system is playing catch-up.
The attrition rate of employees is high due to long hours and on-the-job stress. And finally, there’s a mandatory retirement age (56) which leads to a yearly employee loss.
This shortage is pushing controllers into 60-hour workweeks, in turn leading to a higher burnout rate.
Need more data related to flying? Check Out: All the Things Americans Find Unacceptable on Planes for interesting cultural insights.
Tyler Durden
Fri, 05/30/2025 – 23:00