Mapping Homeownership Rates By US State
As of 2024, nearly two-thirds (65.7%) U.S. households owned their home, while the rest rented.
However, homeownership rates vary widely across statesand between urban, suburban, and rural areas, reflecting differences in affordability, housing availability, and local economic conditions.
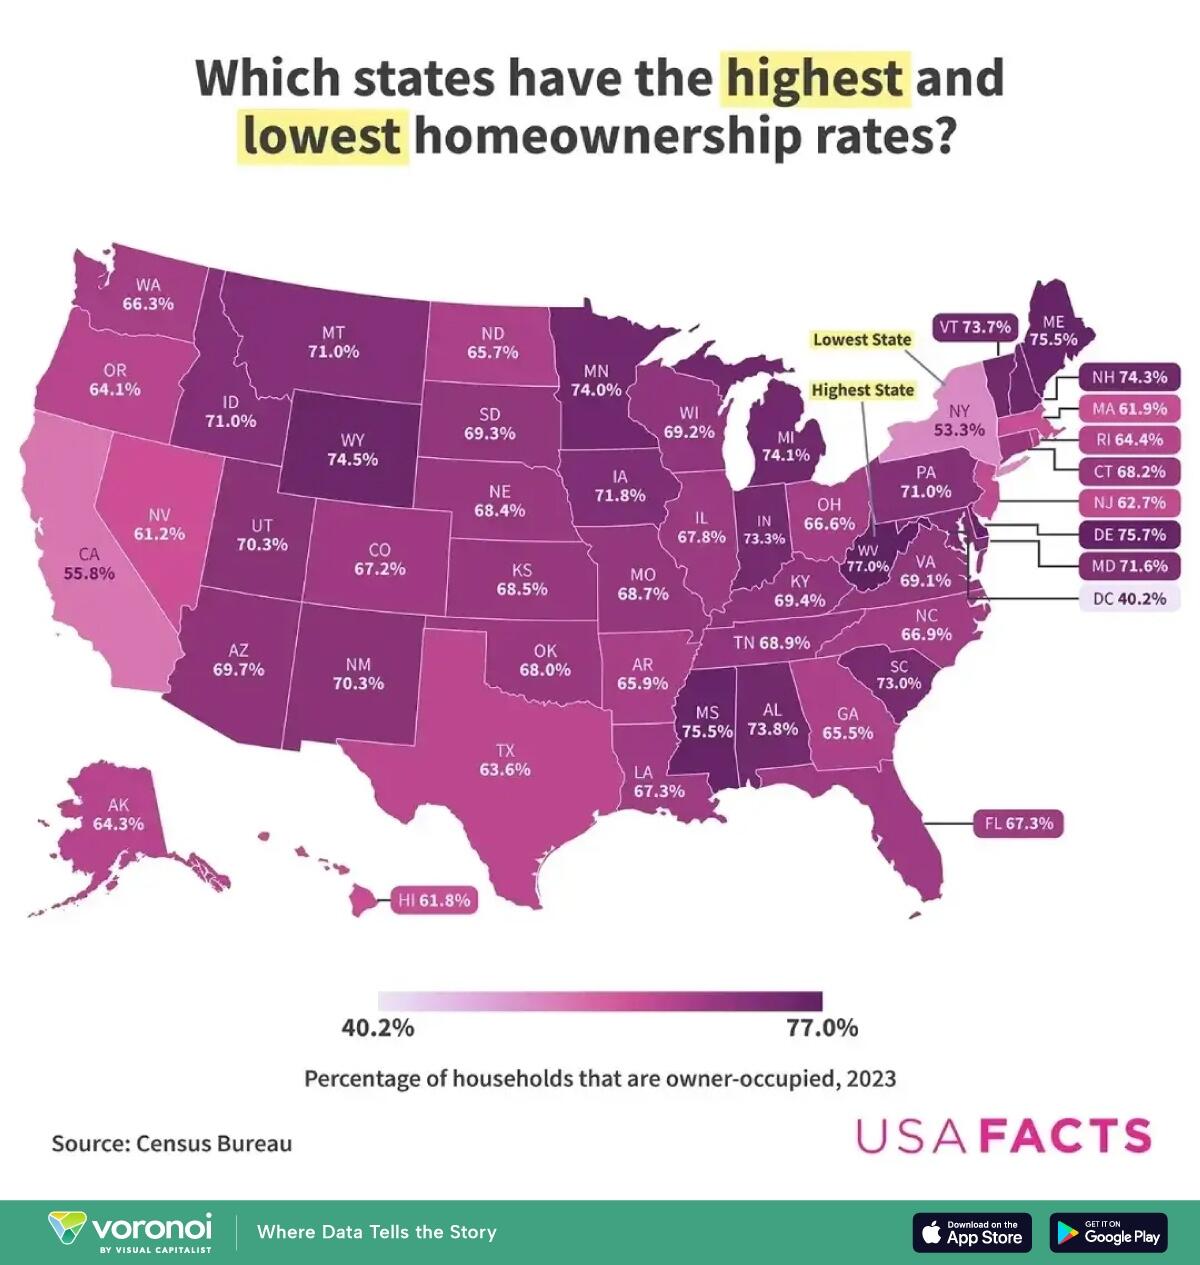
In the map below, by USAFacts, Visual Capitalist’s Kayla Zhuvisualizes the share of households that are owner-occupied by state in 2023.
Data comes from the Census Bureau’s Housing Vacancies and Homeownership portion of the Current Population Survey.
Which State Has the Highest Home Ownership Rate?
Below, we show home ownership rates by state in 2023.
State/Area
Share of households that are owner-occupied (2023)
West Virginia
77.0%
Delaware
75.7%
Mississippi
75.5%
Maine
75.5%
Wyoming
74.5%
New Hampshire
74.3%
Michigan
74.1%
Minnesota
74.0%
Alabama
73.8%
Vermont
73.7%
Indiana
73.3%
South Carolina
73.0%
Iowa
71.8%
Maryland
71.6%
Montana
71.0%
Idaho
71.0%
Pennsylvania
71.0%
Utah
70.3%
New Mexico
70.3%
Arizona
69.7%
South Dakota
69.3%
Wisconsin
69.2%
Virginia
69.1%
Tennessee
68.9%
Missouri
68.7%
Kansas
68.5%
Nebraska
68.4%
Kentucky
68.4%
Connecticut
68.2%
Oklahoma
68.0%
Illinois
67.8%
Louisiana
67.3%
Florida
67.3%
Colorado
67.2%
North Carolina
66.9%
Ohio
66.6%
Washington
66.3%
Arkansas
65.9%
North Dakota
65.7%
Georgia
65.5%
Rhode Island
64.4%
Alaska
64.3%
Oregon
64.10%
Texas
63.6%
New Jersey
62.7%
Massachusetts
61.9%
Hawaii
61.8%
Nevada
61.2%
California
55.8%
New York
53.3%
District of Columbia
40.2%
West Virginia had the highest homeownership rate in 2023, with 77% of households owning their homes.
One key factor behind West Virginia’s high ownership rate is its relative affordability. The state consistently ranks among those with the lowest median home sale prices, and it has the lowest home price-to-income ratio in the country.
Additionally, the state’s largely rural landscape and lower population density may contribute to its high homeownership rate, as housing availability is less constrained than in densely populated urban markets.
In contrast, states with the lowest homeownership rates such as Hawaii, California, and New York, also have some of the highest home prices and home price-to-income ratios, making ownership less attainable.
Places like New York and Calfornia also face high demand in urban centers, a greater share of renters due to job concentration and lifestyle preferences, and tend to have stricter zoning regulations.
This pattern highlights that while affordability plays a significant role, homeownership rates are also influenced by factors like housing supply, economic opportunities, and regional job markets.
Learn more about U.S. real estate in this this graphic, which visualizes the annual nominal change in house prices by state as of the first quarter of 2024.
Tyler Durden
Fri, 03/21/2025 – 21:20